Healthiest products
Products with a health score of A or B.
4188 products
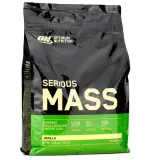
Optimum Nutrition Serious Mass Banana 5540 g
378 kcal
Fat 1,7 g
Carbs 75 g
Prot. 15 g
Sat. fat 0,7 g
Sugars 7,7 g
5,54 kg
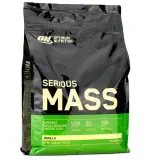
Optimum Nutrition Serious Mass Chocolate Peanut Butter 5540 g
378 kcal
Fat 1,7 g
Carbs 75 g
Prot. 15 g
Sat. fat 0,7 g
Sugars 7,7 g
5,54 kg
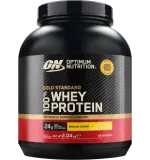
Optimum Nutrition 100% Whey Gold Standard Banana Cream 2010 g
373 kcal
Fat 4 g
Carbs 5 g
Prot. 79 g
Sat. fat 1,8 g
Sugars 3,9 g
2,01 kg
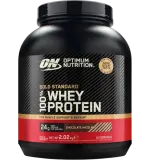
Optimum Nutrition 100% Whey Gold Standard Chocolate Hazelnut 2010 g
367 kcal
Fat 4,4 g
Carbs 6,2 g
Prot. 75 g
Fibre 2 g
Sat. fat 1,7 g
Sugars 3,3 g
2,01 kg
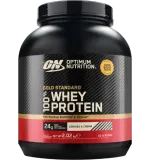
Optimum Nutrition 100% Whey Gold Standard Cookies and Cream 2010 g
373 kcal
Fat 4 g
Carbs 5 g
Prot. 79 g
Sat. fat 1,8 g
Sugars 3,9 g
2,01 kg
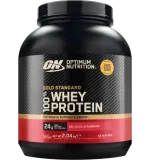
Optimum Nutrition 100% Whey Gold Standard Delicious Strawberry 2010 g
372 kcal
Fat 4 g
Carbs 5,4 g
Prot. 79 g
Sat. fat 1,8 g
Sugars 4 g
2,01 kg
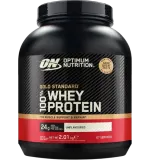
Optimum Nutrition 100% Whey Gold Standard Unflavoured 2010 g
373 kcal
Fat 4 g
Carbs 5 g
Prot. 79 g
Sat. fat 1,8 g
Sugars 3,9 g
2,01 kg
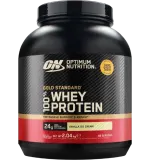
Optimum Nutrition 100% Whey Gold Standard Vanilla Ice Cream 2010 g
374 kcal
Fat 4 g
Carbs 5,6 g
Prot. 79 g
Sat. fat 1,8 g
Sugars 4 g
2,01 kg
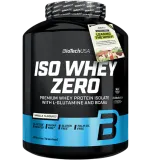
BioTech Iso Whey Zero Vanilla 1816 g
373 kcal
Fat 1,9 g
Carbs 2,9 g
Prot. 86 g
Sat. fat 1,6 g
Sugars 1,4 g
1,816 kg
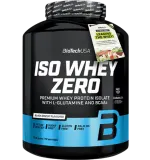
BioTech Iso Whey Zero Black Biscuit 1816 g
374 kcal
Fat 2 g
Carbs 4,4 g
Prot. 84 g
Sat. fat 1,6 g
Sugars 2 g
1,816 kg
About this list
The health score follows the Nutri-Score method: points for energy, sugar, saturated fat and salt, less points for protein and for fruit and vegetable content. Drinks, oils and cheese are judged on their own scales — otherwise olive oil would look worse than a sugary drink purely for being calorie-dense, and water would have nothing to distinguish it. Only A and B products appear here, best first; where two score alike, the cheaper one leads.
Other lists
Low salt
Products with up to 0.3 g of salt per 100 g.
Low sugar
Products with up to 5 g of sugars per 100 g.
Low calorie
Products with no more than 60 kcal per 100 g.
Lean products
Products with up to 3 g of fat per 100 g.
Lithuanian products
Products whose declared country of origin is Lithuania.
Organic products
Products carrying organic or bio labelling.
Gluten free
Products labelled gluten free.
New on the shelves
Products that appeared in shop catalogues in the last month.
Coffee — cheapest per kilo
Ground and bean coffee, ranked by price per kilo.
Tea — cheapest per kilo
Loose and bagged tea, ranked by price per kilo.
Toilet paper — price per roll
Toilet paper, ranked by price per roll.
Napkins and kitchen towel
Napkins, kitchen towel and tissues by price per unit.
Dental care
Toothpaste, brushes and mouthwash by price per litre.
Hair and body care
Shampoo, shower gel, soap and deodorant by price per litre.
Laundry products
Detergents, softeners and bleach by price per litre.
Dishwashing products
Washing-up liquid and dishwasher products by price per litre.
Household cleaners
All-purpose, floor, window and bathroom cleaners by price per litre.
Baby products
Nappies, wipes and baby care by price per unit.
Highest in protein
Products where protein is more than 70 % of all energy.
More protein than chicken
Products with more protein than chicken breast – over 21.6 g per 100 g.
Good carbohydrates
Carbohydrate from starch rather than sugar — rice, grains, pulses.
Good fats
Products whose fat is mostly unsaturated — oils, nuts, oily fish.