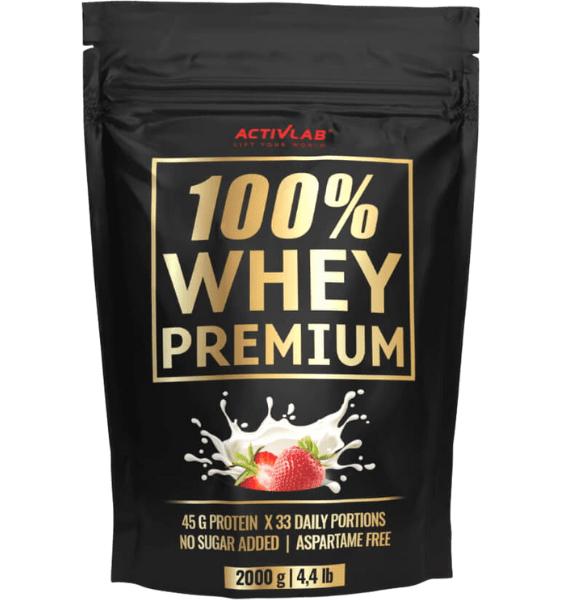
ActivLab 100% Whey Premium Strawberry 2000 g
Healthier picks of the same kind
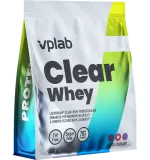 VPLab Nutrition Clear Whey Black Currant 500 g
345 kcal · 100 g
12% fewer kcal
less saturated fat
Compare →
A
89
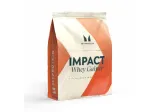 Whey Protein MY PROTEIN GAINER, Vanilla Flavor, 2.5 kg
388 kcal · 100 g
less saturated fat
Compare →
A
82
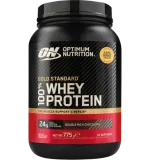 Optimum Nutrition 100% Whey Gold Standard Double Rich Chocolate 768 g
374 kcal · 100 g
less saturated fat
Compare →
A
82
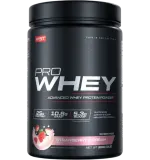
| Nutrient | 100 g | 2 kg |
|---|---|---|
| Energy | 1660 kJ / 392 kcal |
7840 kcal
392% RI
|
| Fat | 5.9 g |
118 g
169% RI
|
| of which saturates | 4.6 g |
92 g
460% RI
|
| Carbohydrate | 9.8 g |
196 g
75% RI
|
| of which sugars | 4.3 g |
86 g
96% RI
|
| Protein | 75 g |
1500 g
3000% RI
|
| Salt | 0.41 g |
8.2 g
137% RI
|
RI – reference intake for an adult (2000 kcal).
From the product label · updated 2026-10
- Salt −2
- Sugars −1
- Energy −4
- Saturates −4
- Protein +7
How this is worked out
We use the Nutri-Score method: points for energy, sugar, saturated fat and salt, less points for protein, fibre and fruit and vegetable content. Drinks, oils and cheese are judged on their own scales — otherwise olive oil would look worse than a sugary drink purely for being calorie-dense.
Shops do not publish fibre, so we treat it as zero. Whole grain and pulse products may therefore score slightly lower here than the label on the packet says.
6 ingredients · 4 additives
Tap an ingredient to see every product that contains it.
Common questions
- How many calories are in ActivLab 100% Whey Premium Strawberry 2000 g?
- 100 g – 392 kcal. 1 pack (2 kg) ≈ 7840 kcal.
- How much protein, fat and carbohydrate?
- Per 100 g: protein 75 g, fat 5,9 g, carbohydrate 9,8 g.
- Is ActivLab 100% Whey Premium Strawberry 2000 g a healthy choice?
- Health grade D (39 of 100), from its sugar, saturated fat, salt, fibre and protein.
Added by a community member · 2026-08-04
Follow stebi.me
Label facts, in your feed every day
Where the sugar hides, which has the most protein, which yogurt is better – short comparisons worth saving.